No cost threshold: the library is fully free and open source.
About
In practice. What you can do with Recharts.
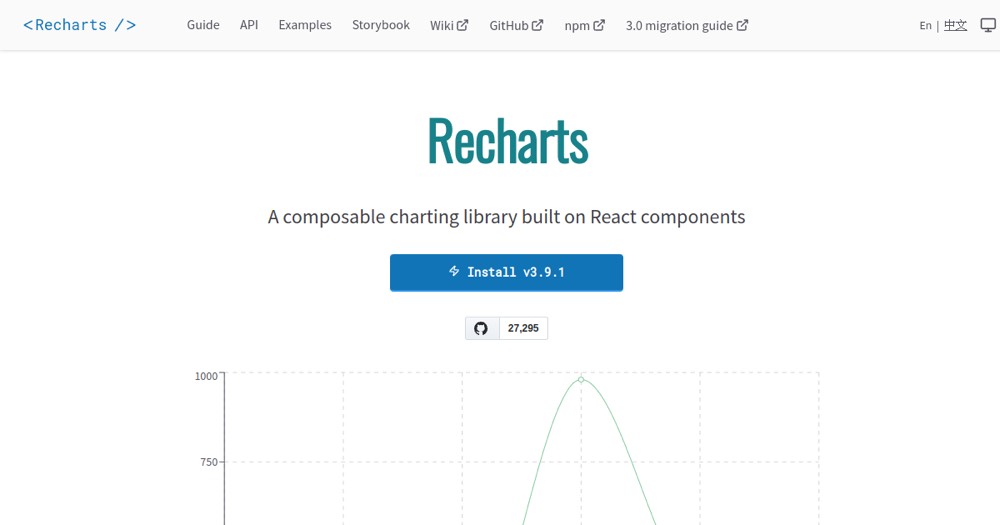
Recharts is a free, MIT-licensed React charting library built on SVG, with composable components for line, area, bar, and other standard chart types. Charts are customized through component properties and custom sub-components rather than low-level drawing code.
There is no paid tier: the whole library is open source. It relies only minimally on D3 internally, so it covers common dashboard and reporting charts well but lacks some of D3's lower-level flexibility for highly custom visualizations. It fits a React developer who wants standard charts as components rather than hand-rolled SVG or D3 code.
Practical uses
Dashboard chartsDrop a line or bar chart component into a React admin dashboard with props instead of writing SVG/D3 rendering code.
Custom chart stylingCompose custom sub-components to adjust tooltips, axes, or legends on a chart beyond the default look.
Features & use cases
Charting
Data visualisation
Pros and cons. What Recharts does well, and what to expect.
Pros
Fully free and open source, with no paid tier or usage limits.
Composable React components cover standard chart types without writing SVG or D3 code by hand.
Cons
Lacks some of D3's lower-level flexibility for highly custom visualizations.
The homepage documentation does not state a minimum required React version.
When it makes sense. Keep Recharts, or challenge it?
Keep if
You are a React developer who needs standard chart types as components without writing low-level D3 or SVG code.
Challenge if
You need highly custom, low-level visualizations that need D3's full flexibility.
Our verdict. What to know about Recharts.
Why this verdict
Great
Added value
A fully free MIT-licensed library that replaces custom D3/SVG chart code with ready-made React components, at no cost.
Simplicity
Composable components with standard chart types let a React developer render a usable chart through props, without writing low-level D3 code.
Fit for purpose
Delivers the advertised composable React chart components (line, area, bar) built on SVG as described on the homepage.
Performance
Covers standard chart types and custom sub-components well, but relies only minimally on D3 internally and so lacks some of D3's lower-level flexibility for highly custom visualizations.
Reversibility
A fully free, MIT-licensed open-source library with no vendor lock-in: the code and charts stay in the project's own codebase.