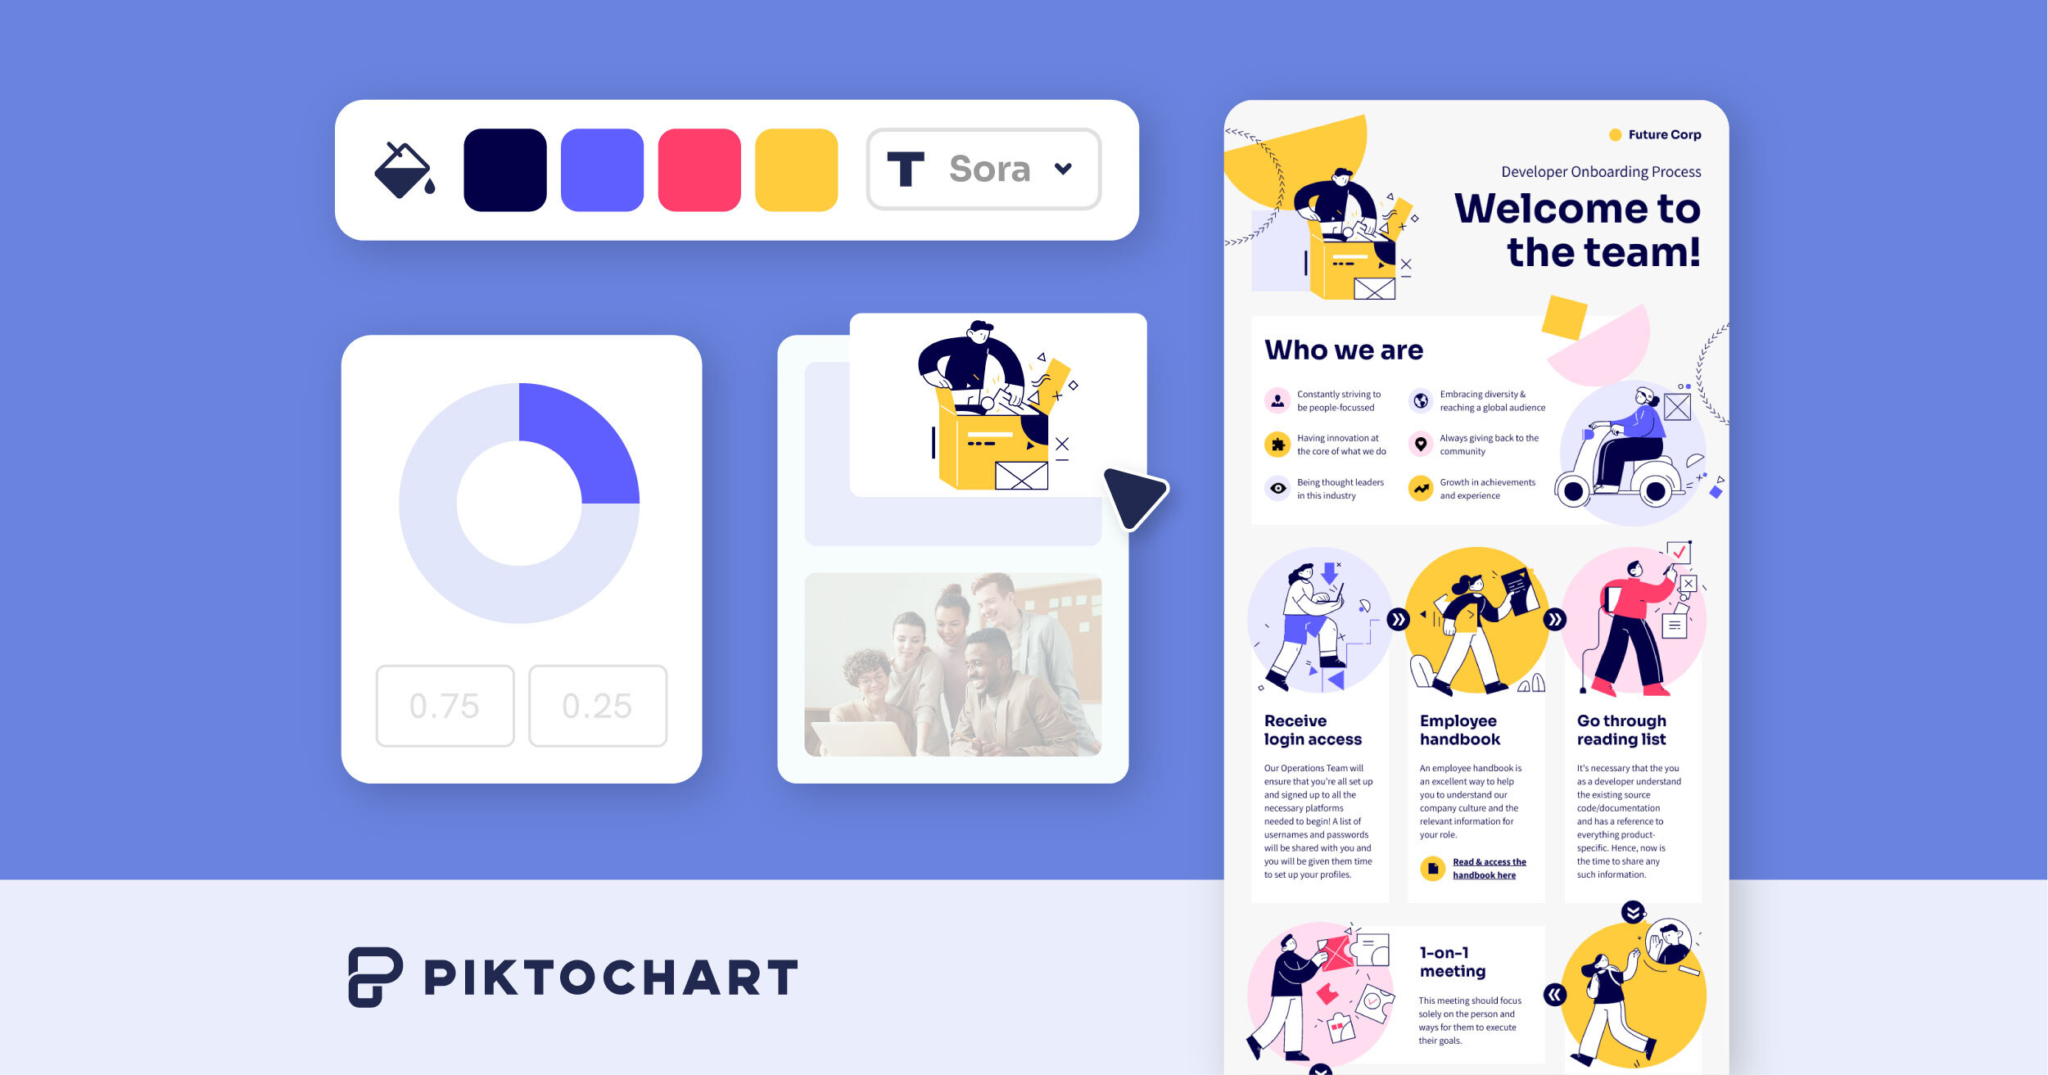
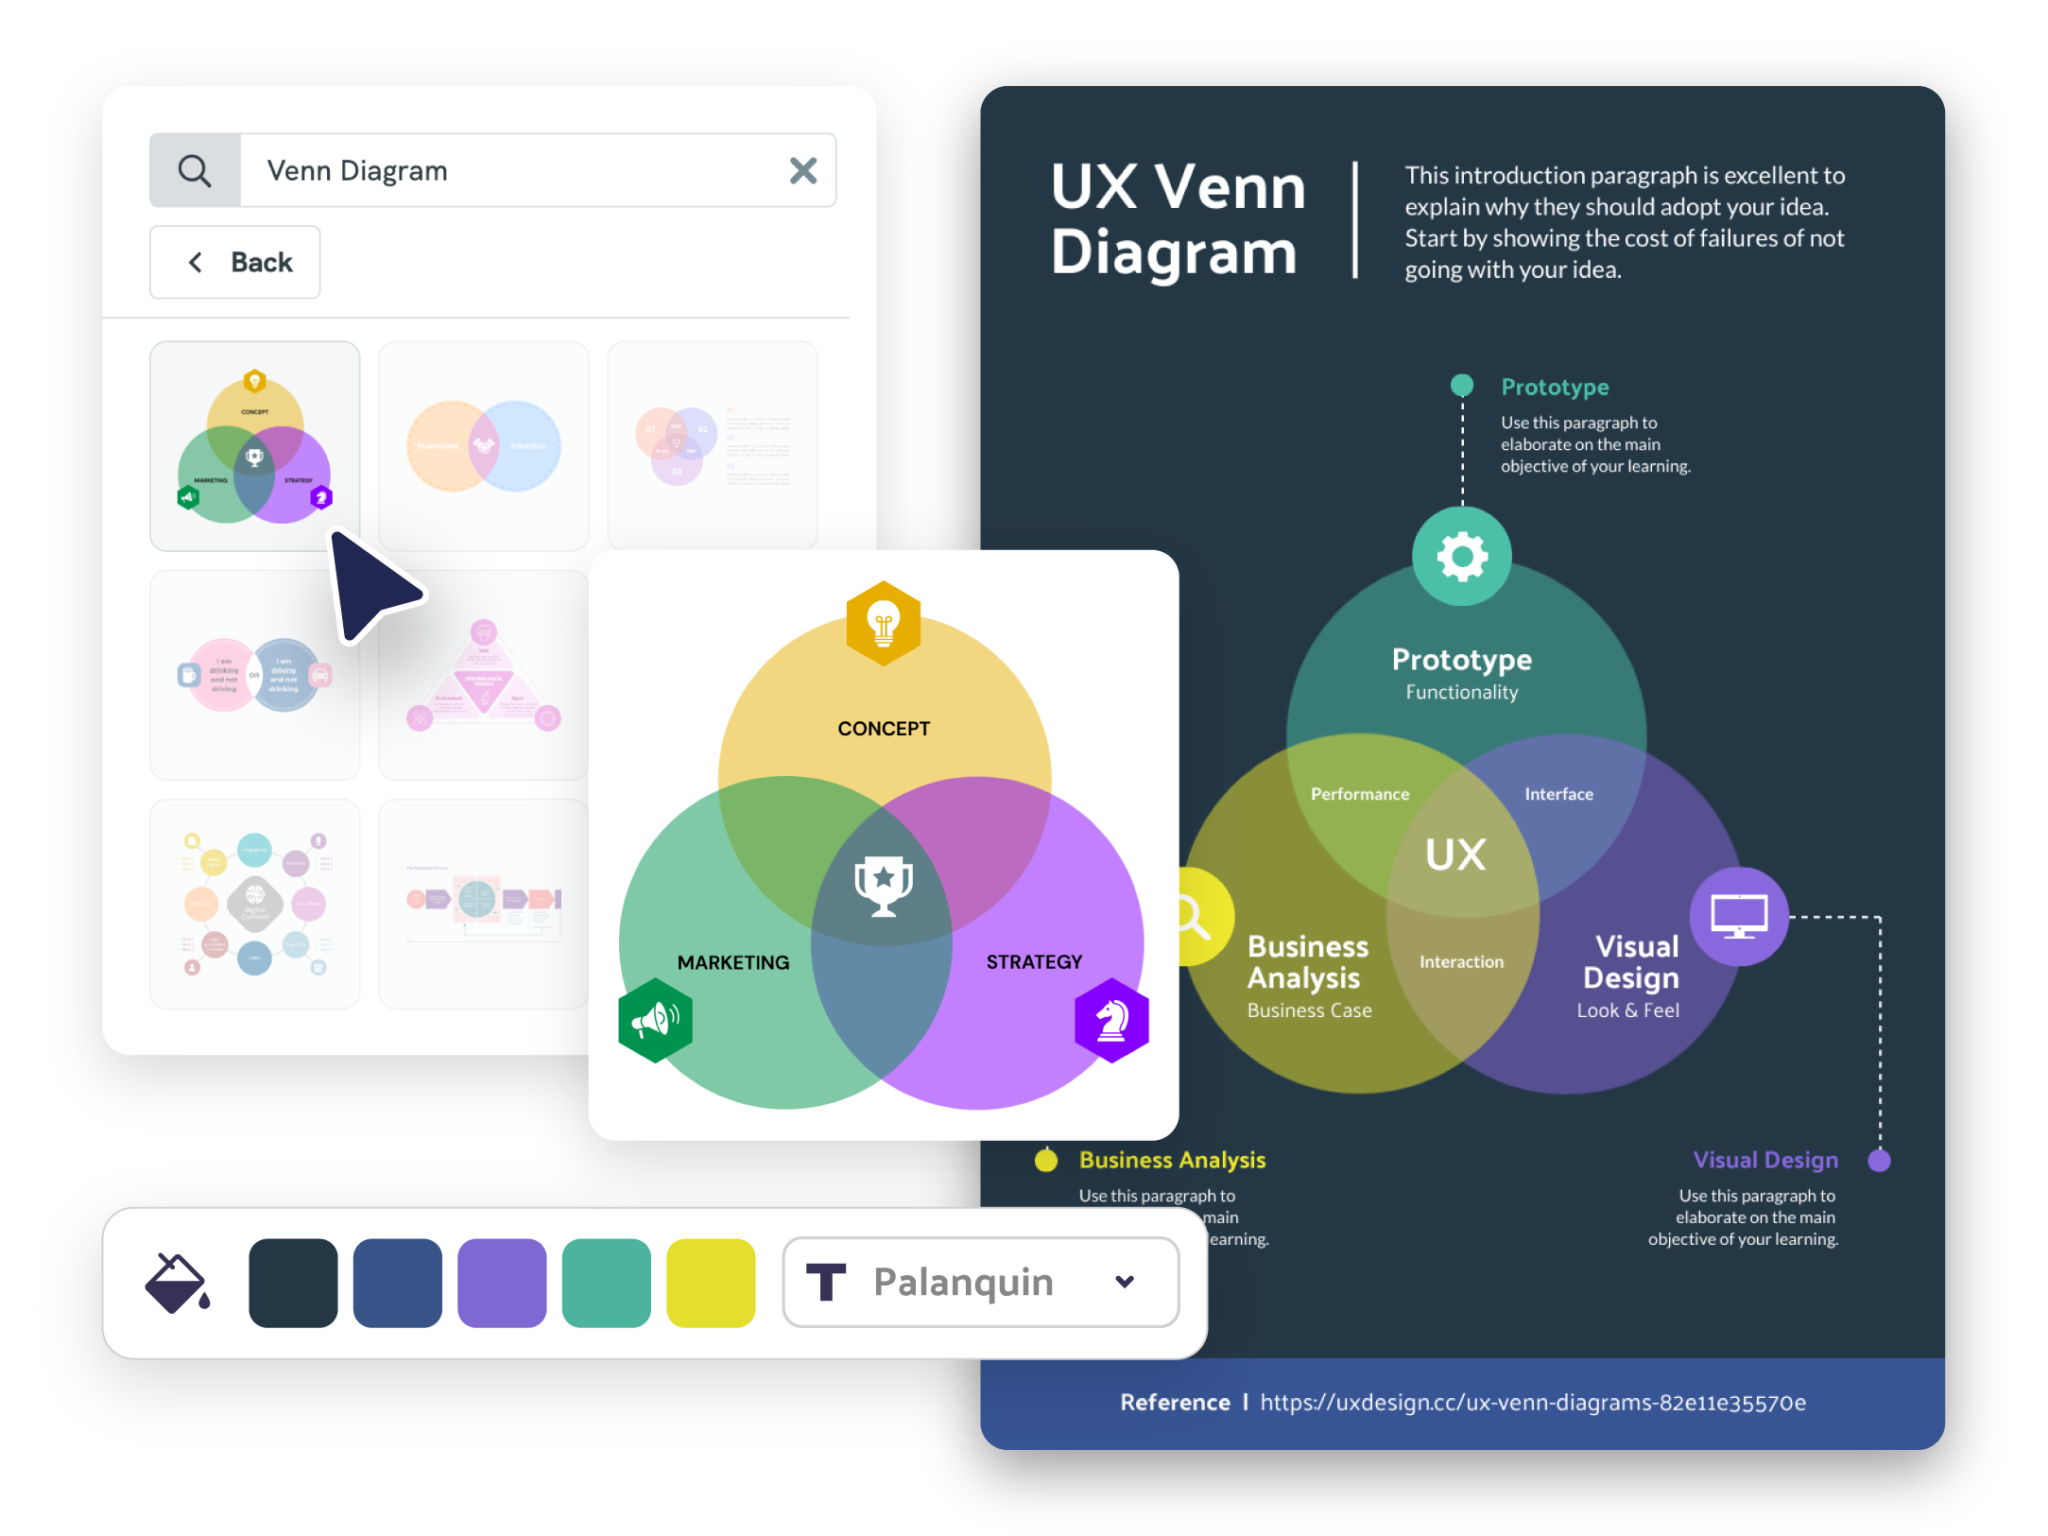
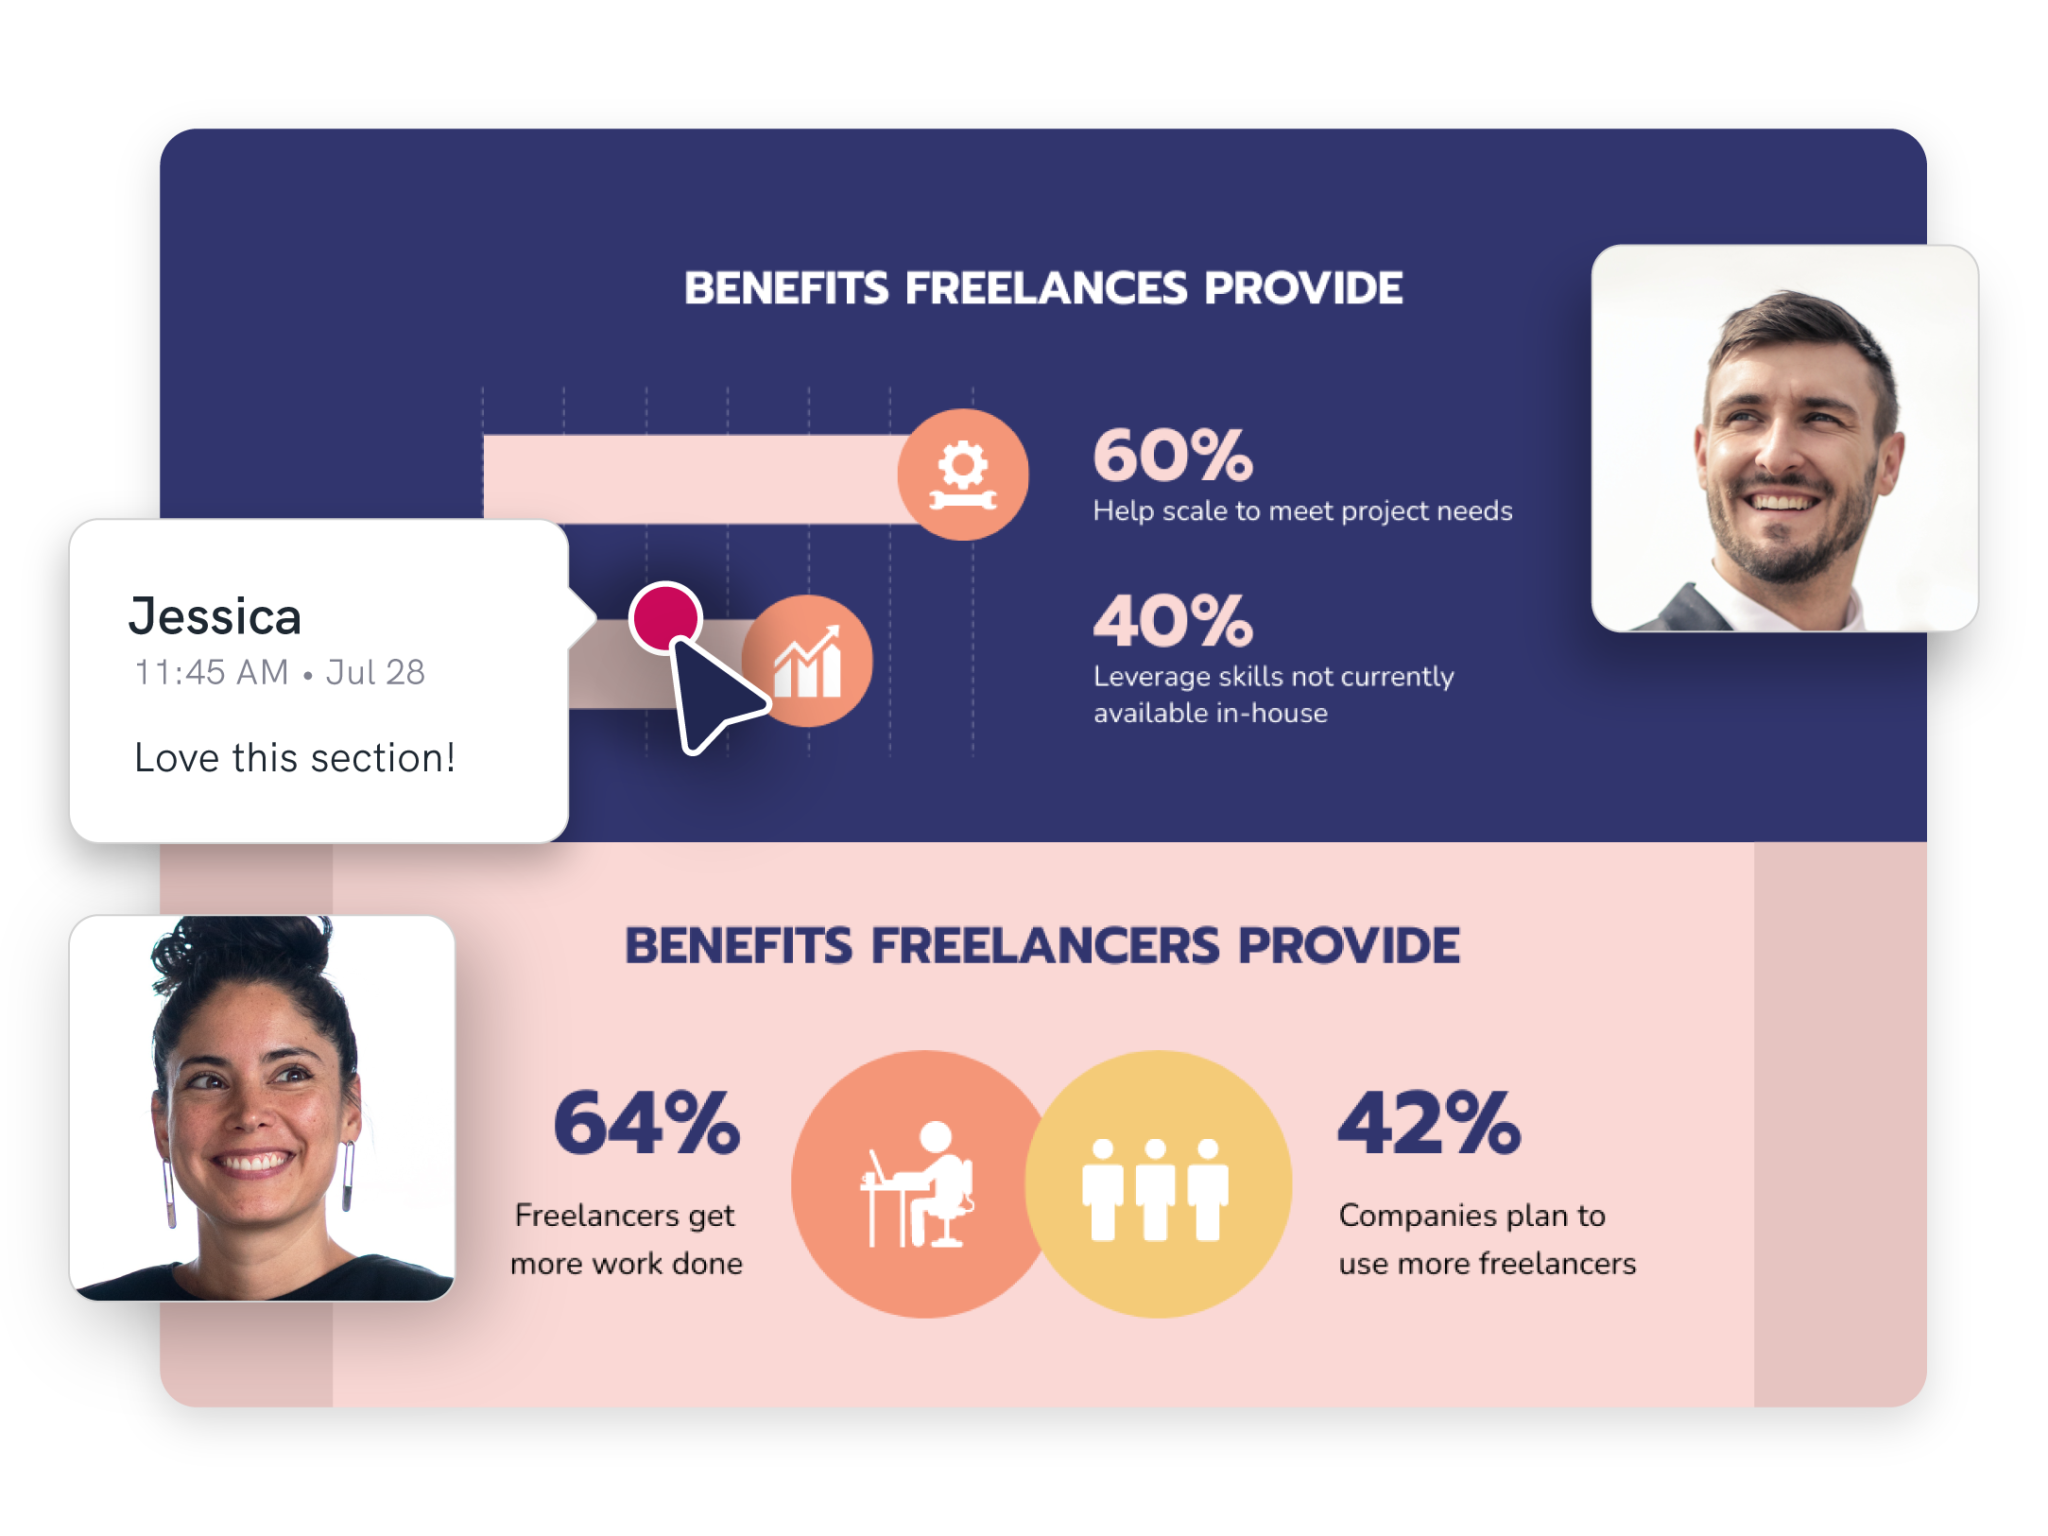
Piktochart helps turn dense content into a visual deliverable: an infographic, report, presentation or communication document. It is relevant to consultants, trainers and small teams who need to explain an idea without starting from a blank page.
Its value lies in structuring information before styling it. Templates, charts, diagrams and AI tools provide a starting point; figures, wording and hierarchy still need review before sharing.
Choose based on the deliverable your client requires. A web graphic has different constraints from a printed document or a presentation that needs further editing. Check the export format before paying, then test a real brief with your own content. This is a documentary review, not a hands-on test.
Practical uses
Explain a methodAn infographic.
Summarize a client report.
Prepare training material.
Features & use cases
Creation contenu
Presentations
The case for and against. What Piktochart does well, and when it costs too much.
For. What works in its favour.
Formats focused on explaining information.
Templates, charts and diagrams together.
AI assistance for an initial visual draft.
You prefer adapting an existing structure.
Against. What to plan for.
Free is limited to two PNG downloads.
PDF and PowerPoint require Business in the standard pricing grid.
Per-member pricing increases the team cost.
You need completely free-form graphic design.
Our verdict. What to know about Piktochart.
How the score breaks down
Added value
4/5
Useful for turning dense content into a visual deliverable when the need is recurring. Documentary review of official pages, 2026-09-27.
Simplicity
4/5
Templates reduce initial setup. Usability not tested. Documentary review of official pages, 2026-09-27.
Fit for purpose
4/5
Reports and explanatory material fit consulting and training work. Documentary review of official pages, 2026-09-27.
Performance
4/5
Charts, diagrams and AI cover several steps; AI output quality not measured. Documentary review of official pages, 2026-09-27.
Reversibility
3/5
Exports depend on the plan; PNG should not be treated as a fully editable document. Documentary review of official pages, 2026-09-27.