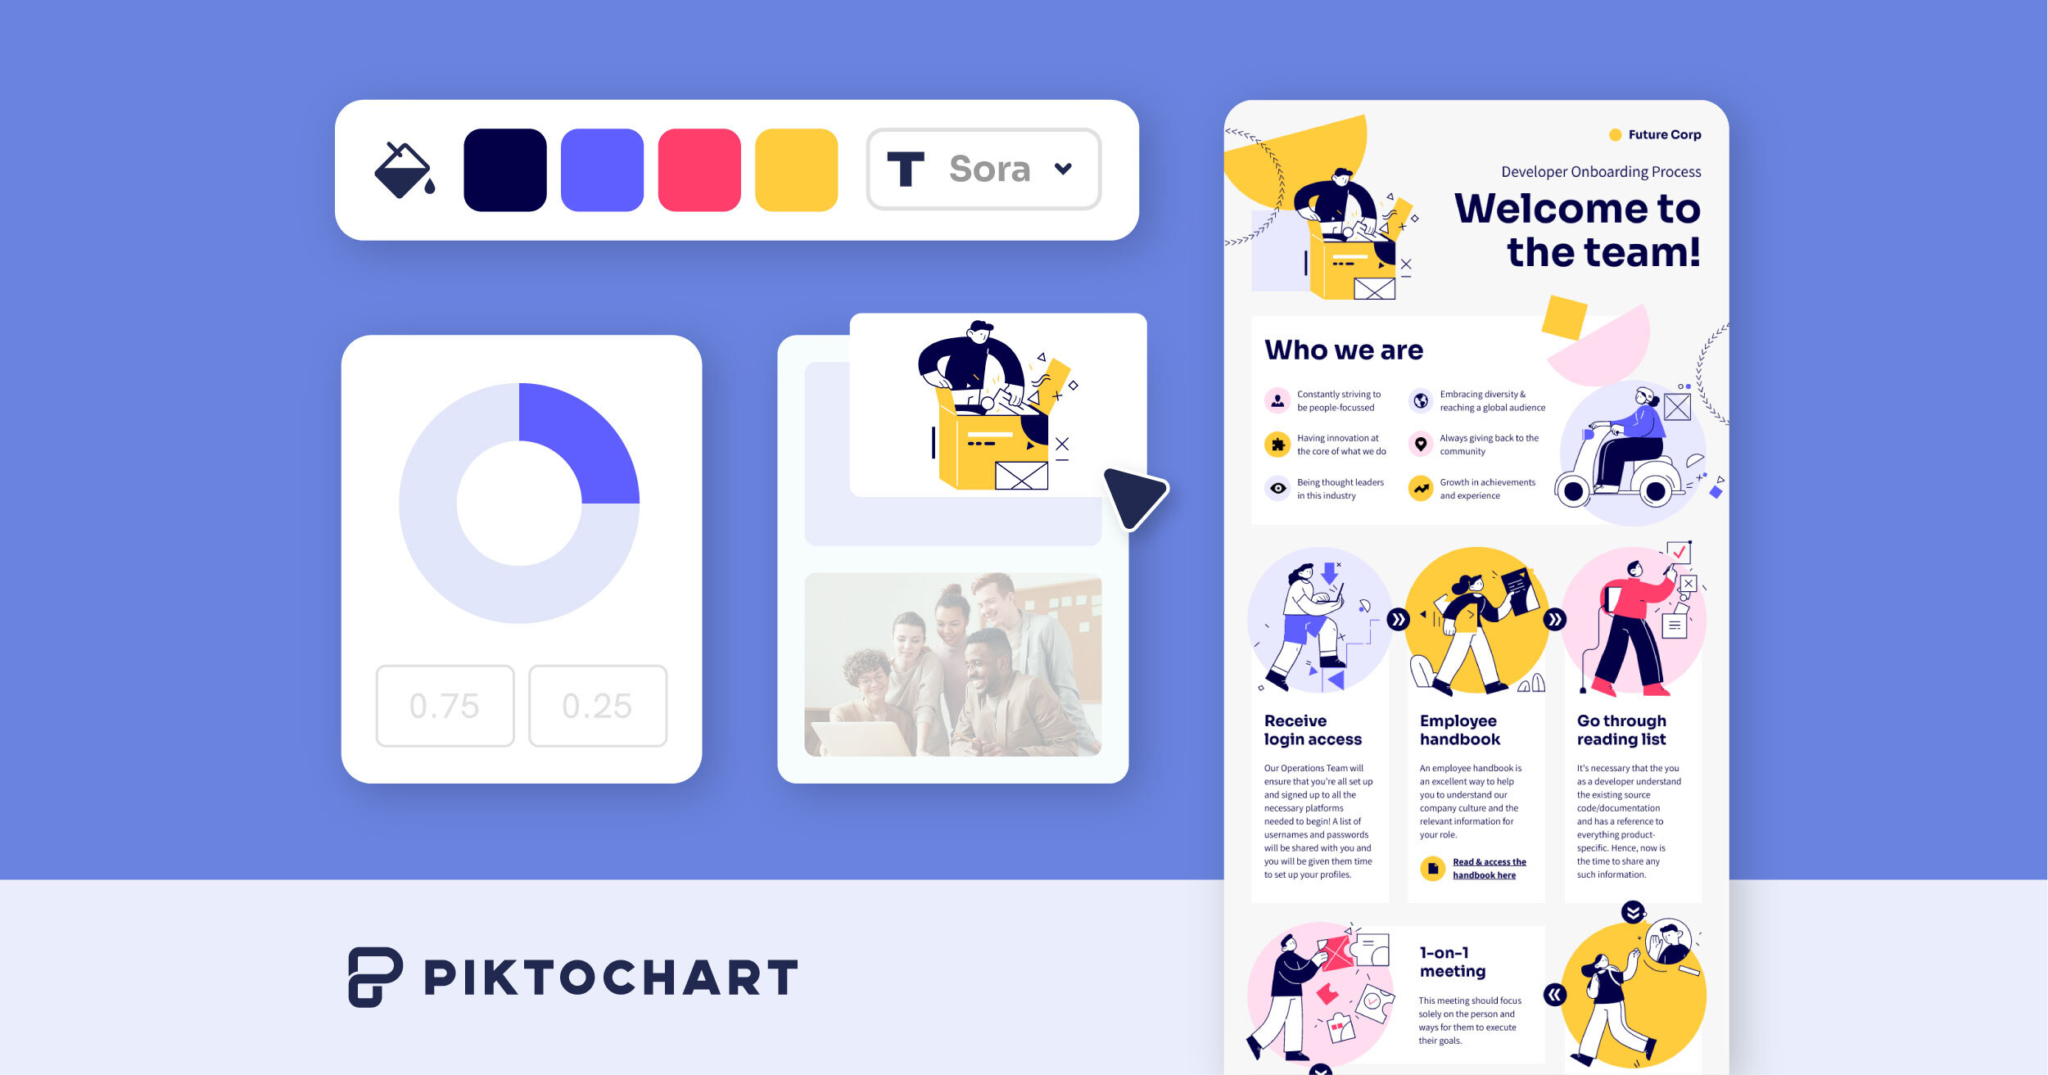
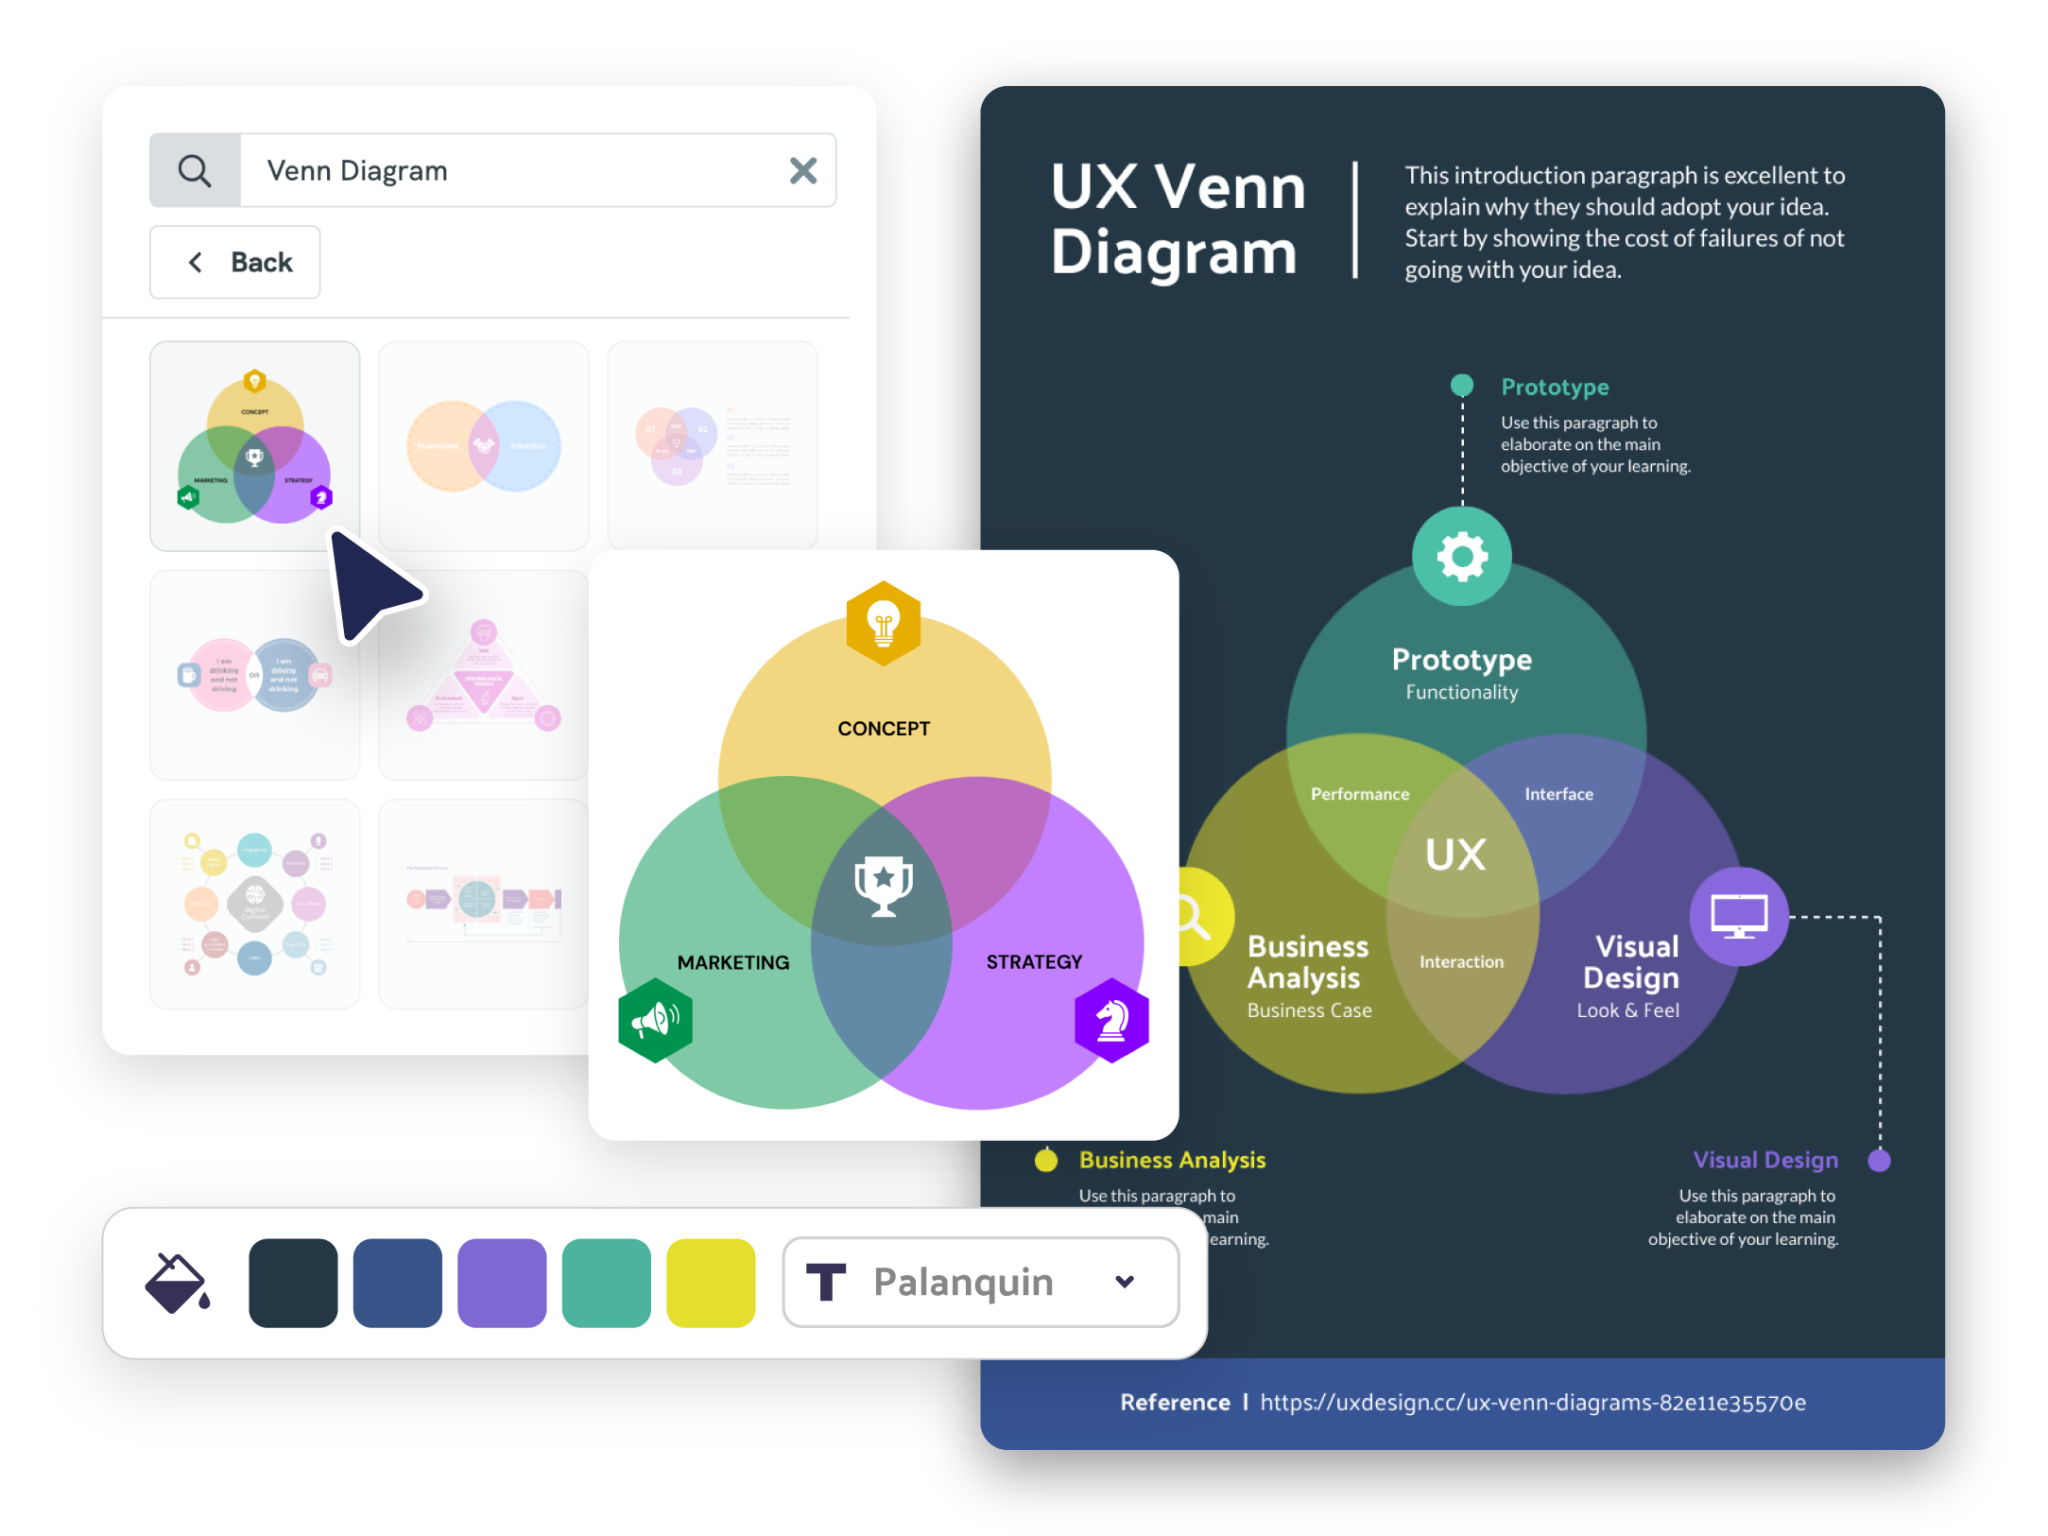
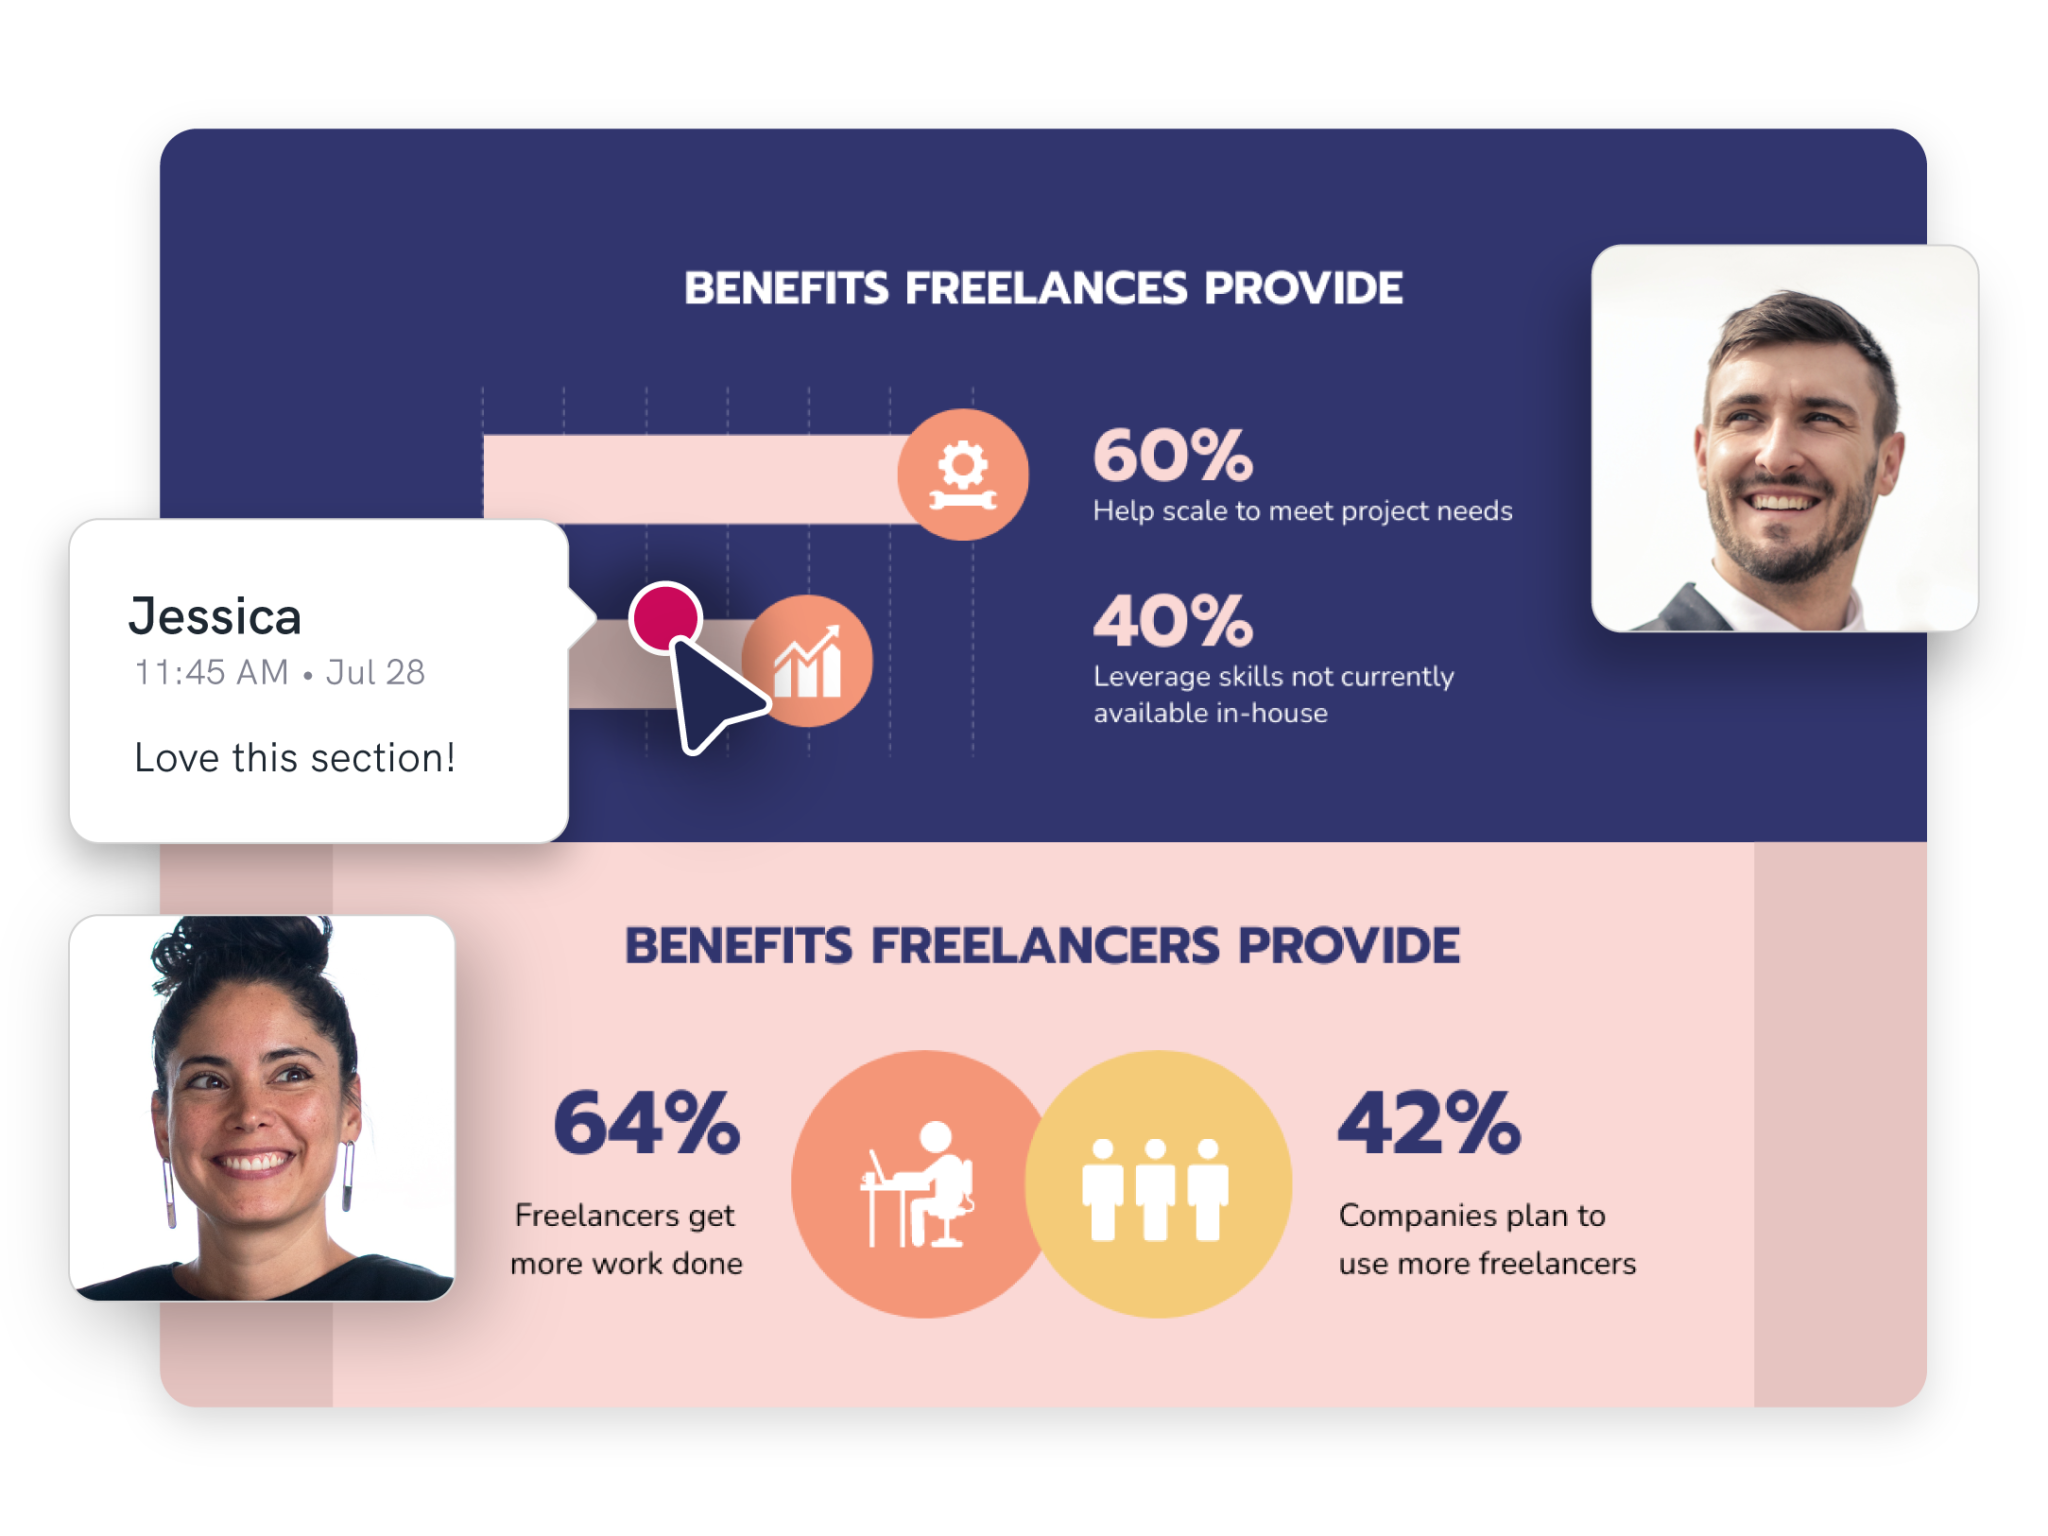
Piktochart helps turn dense content into a visual deliverable: an infographic, report, presentation or communication document. It is relevant to consultants, trainers and small teams who need to explain an idea without starting from a blank page.
Its value lies in structuring information before styling it. Templates, charts, diagrams and AI tools provide a starting point; figures, wording and hierarchy still need review before sharing.
Choose based on the deliverable your client requires. A web graphic has different constraints from a printed document or a presentation that needs further editing. Check the export format before paying, then test a real brief with your own content. This is a documentary review, not a hands-on test.
Practical uses
Explain a methodAn infographic.
Summarize a client report.
Prepare training material.
Features & use cases
Creation contenu
Presentations
The case for and against. What Piktochart does well, and when it costs too much.
For. What works in its favour.
Formats focused on explaining information.
Templates, charts and diagrams together.
AI assistance for an initial visual draft.
You prefer adapting an existing structure.
Against. What to plan for.
Free is limited to two PNG downloads.
PDF and PowerPoint require Business in the standard pricing grid.
Frequently asked questions. What people ask about Piktochart.
What is Piktochart used for?
Infographics, reports and visual presentations, with templates and AI assistance.
How much does Piktochart cost?
Free: two PNG downloads. Pro: USD 120/member/year or USD 15/month. Business: USD 204/member/year or USD 20/month. Price verified on September 27, 2026.
Is Piktochart suitable for beginners?
Explain information through reports, infographics and presentations.
Is Piktochart worth the price?
Test your most representative document. Pro may fit PNG delivery; choose Business if PDF or PowerPoint are essential.
What are the best alternatives to Piktochart?
The main alternatives to Piktochart are: Canva, Visme. Free alternatives: Visme.