


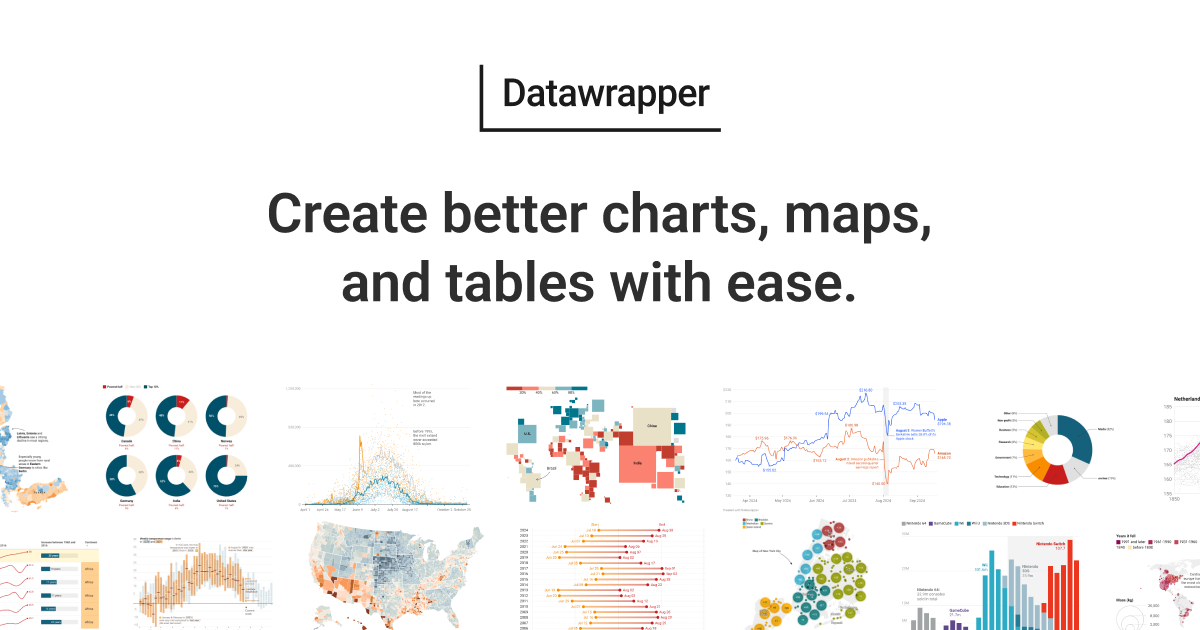
    Datawrapper preview

    Datawrapper Review and verdict 2026

    Fast creation of editorial charts, maps, and tables.

    Free.

    Datawrapper

    ToolTrim Verdict
    3.8/5
    Decent

    Datawrapper shines for newsrooms and analytics teams publishing infographics regularly; for complex real-time dashboards, use Tableau or Looker instead.

    Pricing verified on

    Our take

    Understanding Datawrapper.

    Data visualization tool designed for journalists, publishers, and analytics teams. Create, publish, and embed charts, maps, and tables without code, with clean, accessible design.

    Practical uses

    • Create infographics for news articles.
    • Publish interactive visualizations on a website.
    • Generate automated reportsCharts (Sheets).

    Pros and cons

    What Datawrapper does especially well — and the limits to anticipate.

    Pros

    • Intuitive, no-code interface.
    • Clean, accessible design by default.
    • Free PNG export on the Free plan.
    • Real-time Google Sheets integration (Business).
    • Perfect for editorial articles and reports.

    Cons

    • Real-time dashboard features are limited.
    • Advanced features are costly (custom themes).
    • API new (billing starts Sept 2026).
    • Not ideal for complex internal dashboards.

    Datawrapper: when it makes sense.

    Datawrapper shines for newsrooms and analytics teams publishing infographics regularly; for complex real-time dashboards, use Tableau or Looker instead.

    Keep if

    You regularly create visualizations for articles or reports.. You want a no-code, accessible solution.

    Challenge if

    You need complex, real-time dashboards.. You rarely create charts.

    Our verdict on Datawrapper.

    Why this verdict

    Decent

    Datawrapper is fairly easy to replace with an alternative, a free tier to test before paying, clearly documented use cases.