No numeric decision threshold applies: the core library is free with no usage cap, so the comparison is against the engineering time to integrate it, not a price.
About
In practice. What you can do with ApexCharts.
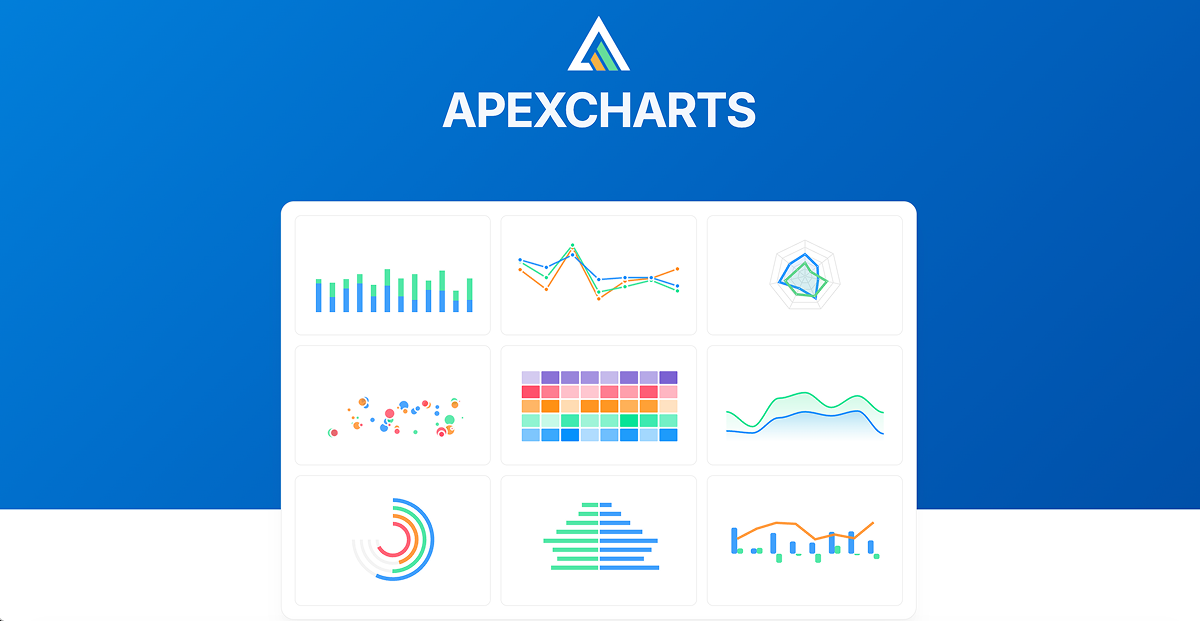
ApexCharts is an MIT-licensed JavaScript charting library with 20+ interactive SVG chart types, line, area, candlestick, heatmap, treemap and more, for React, Vue, Angular or vanilla JS. It's built for speed, with a claimed 100,000-point line chart rendering in 29ms, and it's part of a wider family that also covers data grids, Gantt charts and maps as separate products.
The core library costs nothing and has no usage cap, but it's an embeddable component, not a hosted product: a team integrates and maintains it inside their own app. It fits a developer who wants interactive charts without paying for a hosted analytics or charting SaaS.
Practical uses
EmbedAdd an interactive line or candlestick chart to a React or Vue dashboard using the free core library.
ScaleRender a large dataset (tens of thousands of points) in a browser chart without switching to a heavier visualization stack.
Features & use cases
Charting
Data visualisation
Pros and cons. What ApexCharts does well, and what to expect.
Pros
Free and open source under MIT, with no usage cap on the core library.
Covers 20+ chart types across the three major frameworks plus vanilla JS in one library.
Cons
No hosted option: a team has to integrate and keep it updated inside their own app.
Companion products (data grid, Gantt, org charts) are separate, unverified-pricing products, not included in the free core library.
When it makes sense. Keep ApexCharts, or challenge it?
Keep if
Keep if you're embedding charts in a web app built with React, Vue, Angular or vanilla JS and want a free library instead of a hosted charting product.
Challenge if
Avoid if you need a hosted, maintenance-free charting product rather than a library to integrate and maintain yourself.
Our verdict. What to know about ApexCharts.
Why this verdict
Great
Added value
A free, MIT-licensed library covering 20+ chart types removes the cost of a hosted charting product for most web apps.
Simplicity
An embeddable JS library with framework support for React, Vue and Angular gets a chart on screen quickly for a developer already working in one of those stacks.
Fit for purpose
Delivers the stated chart types and performance claim (100k points in 29ms) as described for an embeddable library.
Performance
20+ chart types, large-dataset performance and a broader product family (grids, Gantt, maps) place it at the upper end of free charting libraries.
Reversibility
As an MIT-licensed open-source library with no hosted lock-in, switching away mainly means rewriting chart configuration, but the collected sources don't detail an export or migration path.